Investigating Build Regressions From the Last Known-Good Build
The following scenario is a case study. A Jenkins build fails in an integration test. The console contains a NoSuchMethodError, so the immediate task seems straightforward: find the incompatible dependency. Then someone points out that the last three builds failed too. Another developer asks whether the dependency change was already present in a successful build. The error is useful, but it has not yet established the investigation boundary.
That boundary matters. A log describes what happened during one execution. Investigating a regression also requires knowing what worked before it, which changes arrived afterward, and whether later failures represent the same problem.
The question is: what changed between the last successful build and the failed build, and which changes are most likely related to the regression?
Starting there gives the investigation an order. Establish the successful baseline. Examine the changes after it. Locate the first matching failure when the retained history supports that conclusion. Then connect those changes to the diagnostic and decide what to inspect first.
Establish the window before reading every change
Consider this synthetic payments build history. It is an illustrative investigation, not a report of a production incident:
| Build | Result | Retained failure evidence |
|---|---|---|
#869 |
SUCCESS |
Successful baseline |
#870 |
FAILURE |
Specific payments API failure signature |
#871 |
FAILURE |
Same signature |
#872 |
FAILURE |
Same signature |
#873 |
FAILURE |
Same signature; current investigation |
The failure occurs during payments integration tests. The retained diagnostic includes NoSuchMethodError and the relevant stack frame. SCM history contains changes to payment-common/pom.xml, PaymentClient.java, documentation, and an unrelated service.
If we compare only #872 with #873, we may concentrate on a change made after the problem began. If we collect everything between #869 and #873 and give every file equal attention, later changes can obscure the earlier candidates.
The complete retained sequence supports a more useful window: #869 to #870. Build #870 is the first bad build in this observed sequence, while #873 supplies the current failure signal. Those are different roles and should remain visible.
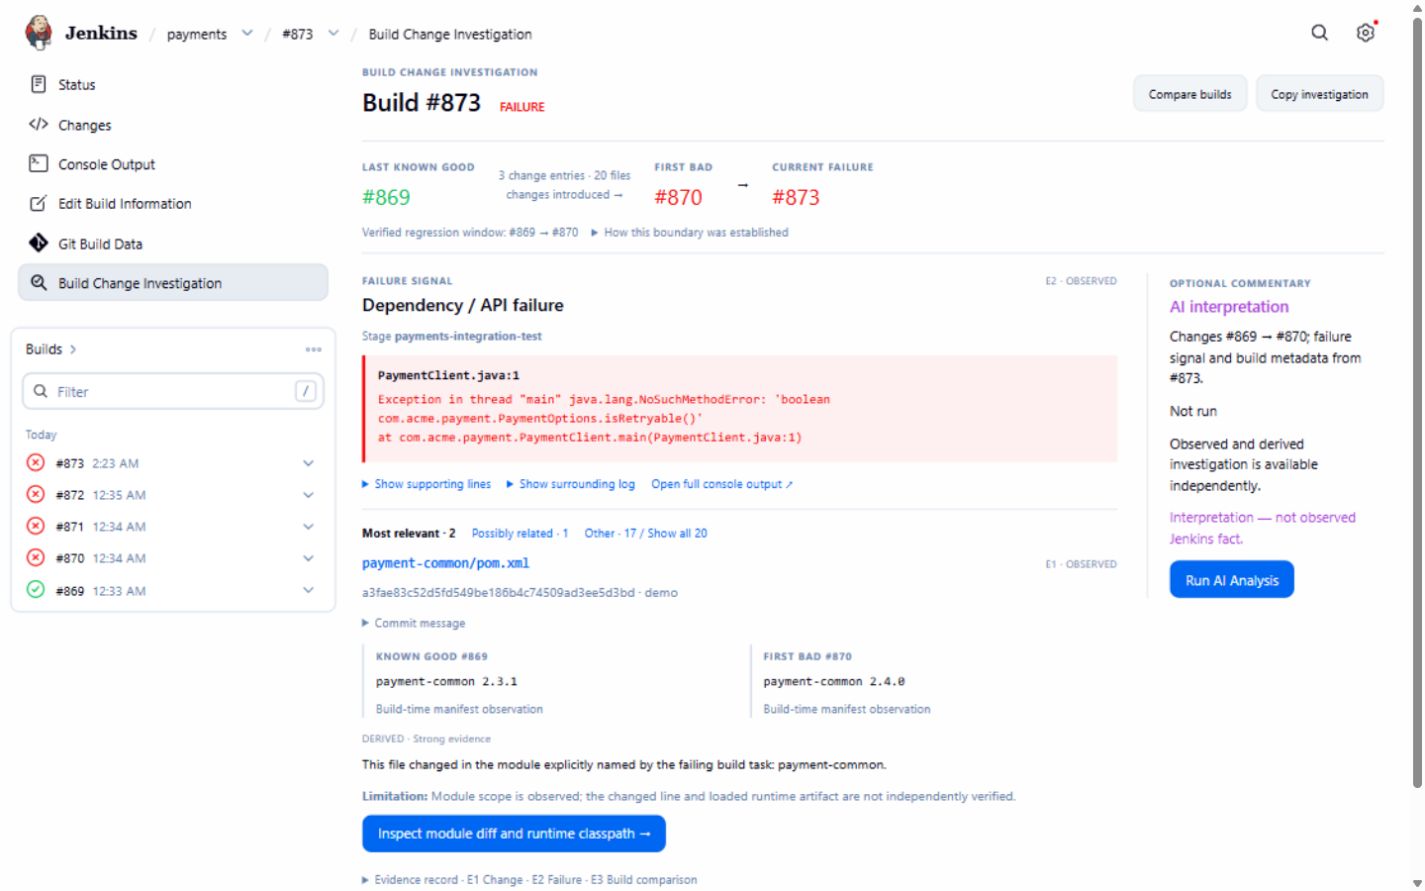
A real V3 runtime capture using synthetic data: the change window stays beside the failure evidence.
Build numbers alone are insufficient. If #872 has been deleted, or it was aborted, the sequence no longer verifies a continuous run of matching failures. An investigation should then say that the first bad build could not be narrowed. It should not silently bridge the gap because #871 and #873 look alike.
Even a verified boundary does not prove that a commit caused the failure. A changed runtime dependency, external service, or environment could still be involved. What the boundary establishes is where the retained build evidence places the start of this failure sequence.
Connect a diagnostic to a candidate, then state the limitation
In the payments example, NoSuchMethodError makes dependency compatibility worth inspecting. It does not, on its own, tell us which dependency declaration is responsible. The exception, missing method, stack frame, build-task context, and changed paths need to be considered together.
Suppose the retained task output explicitly names payment-common, and its pom.xml changed in the narrowed window. That is a useful deterministic relationship: a file changed within the module named by the failing task. The next check is the module diff and the runtime classpath. The relationship does not establish which artifact was actually loaded when the test ran.
A changed PaymentClient.java may offer a different relationship if the diagnostic names that source file. It deserves early inspection, but “the file changed” still does not mean “the failing line changed.” The diff must answer that second question.
Stage context needs similar care. A stage label matching the first component of a changed path can help order the candidates. A changed Jenkinsfile may also be relevant when a failing stage is observed. These are indirect clues. They do not establish that a particular configuration change executed in that stage or that the stage used a particular checkout.

Ranking provides an inspection order while keeping the other retained changes available.
The unrelated documentation should remain accessible. It should not receive the same prominence as a source path named by the failure, and it should not be declared harmless simply because no direct relationship was found.
This is also why the explanation beside a ranking matters more than its position. “Strong evidence” is useful when it refers to a stated relationship. An unexplained confidence percentage would give the engineer less to verify.
Put the exact failure where the engineer starts
Console Output remains necessary for many investigations. It should not be necessary merely to discover the diagnostic that the investigation is discussing.
For a compiler failure, the useful starting point may be a file, line and column, followed by cannot find symbol and the unresolved symbol. For the payments failure, it is the API linkage error and the relevant stack frame. A test failure may need the test name. The form varies; the requirement is to preserve the evidence that makes the next check specific.
A short description such as “dependency issue” throws away too much. Conversely, displaying the entire Maven or Gradle log moves the original search task into a different page. The useful middle ground is an extracted diagnostic with supporting lines, a surrounding excerpt, and a link to the full console.
Extraction also has limits. The relevant lines may not have been retained, or the output may not match a recognized diagnostic format. In that case, showing the available excerpt and the evidence gap is more honest than manufacturing a precise failure category.
Bringing this workflow into Jenkins
Build Change Investigator implements this workflow on the Jenkins build page. It collects SCM changes and bounded, redacted failure evidence, then presents an investigation based on deterministic relationships. The core workflow does not require an AI provider.
The current implementation recognizes structured compiler diagnostics, Java exceptions, test failures, and API linkage errors when the retained evidence supports them. It ranks changes using direct source-path matches, explicit build-task module information, and weaker stage or configuration overlap. It does not traverse the full Pipeline execution graph or establish checkout ownership for every stage.
Its first-bad calculation requires adjacent build numbers, matching specific failure signatures, and FAILURE results back to a successful build. Missing builds, unavailable signatures, different failures, and intermediate results such as UNSTABLE or ABORTED leave the boundary unknown. The history inspection is bounded rather than an unlimited search.
Sometimes the automatic window is not the question an engineer needs to ask. Build-to-build comparison lets the engineer choose two completed builds of the same accessible job and inspect their evidence in the same view. The baseline must precede the target, and the supported comparison window is bounded to 100 build numbers.
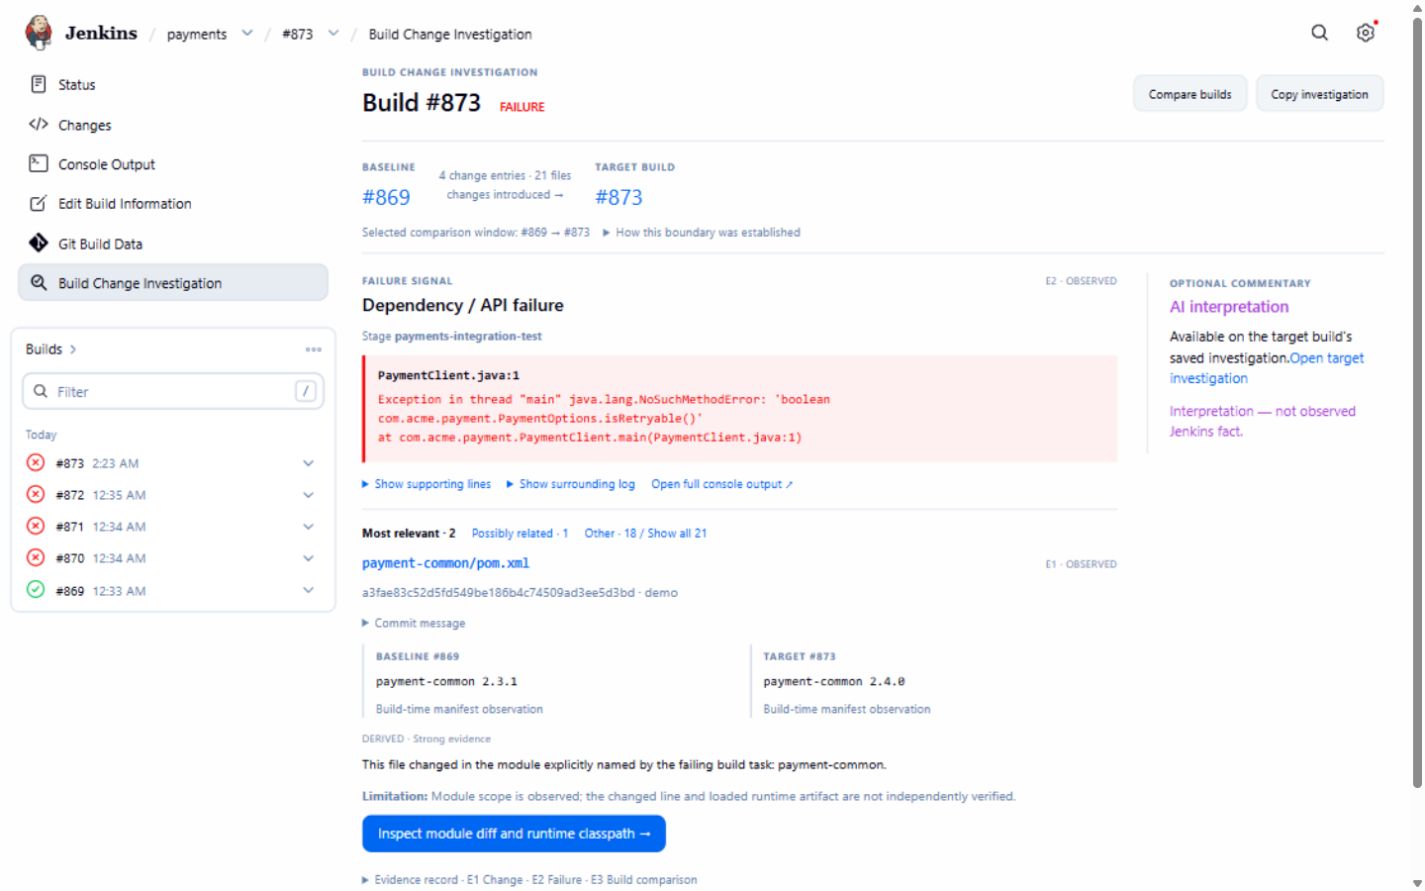
Explicit comparison uses the same evidence presentation with a selected build window.
Similar past failures provide another lead. A matching retained signature from before a successful boundary may be worth revisiting. It is historical context, not evidence that the earlier and current failures share a cause. There may be a useful old investigation to read; there may also be no recorded resolution.
Native Jenkins Build History remains available alongside the investigation. Copy investigation produces a bounded text summary for a handoff, including the evidence and suggested checks. Neither feature requires replacing the existing build navigation or asking someone else to reconstruct the entire case from console links.
Keep the investigation verifiable
Optional AI interpretation can suggest an explanation and checks using the collected evidence. An authorized user explicitly runs it; opening the page does not invoke a provider. Before an AI request, the plugin limits the evidence and applies best-effort secret redaction. That is a protection, not a guarantee that every sensitive string will be recognized.
For a verified first-bad case, the interpretation receives the narrowed changes while the failure signal and build metadata remain identified as belonging to the current build. That distinction prevents a later failure from being presented as though its log came from the first bad build.
The interpretation should be read after the observed facts and their deterministic relationships. A fluent explanation cannot establish a dependency version that was not captured or prove which runtime artifact was loaded. If a provider fails, the engineer still has the deterministic investigation to work from.
For the payments example, a useful handoff is modest and concrete: #869 succeeded; the matching failure sequence starts at #870; the narrowed changes include a file in the failing module; the current diagnostic is NoSuchMethodError; inspect the module diff and loaded dependencies first. That gives the next engineer something to test.
The goal is not to replace Console Output or claim a root cause automatically. It is to give the engineer a better starting point: what last worked, what changed, where the matching failures began, and what evidence is worth checking first.
Build Change Investigator is available in the Jenkins plugin directory, and the source and issue tracker are available in the official Jenkins repository.